Statistically evaluating mixed-effects models for EEG analysis using large-scale simulations
for Luis Lips
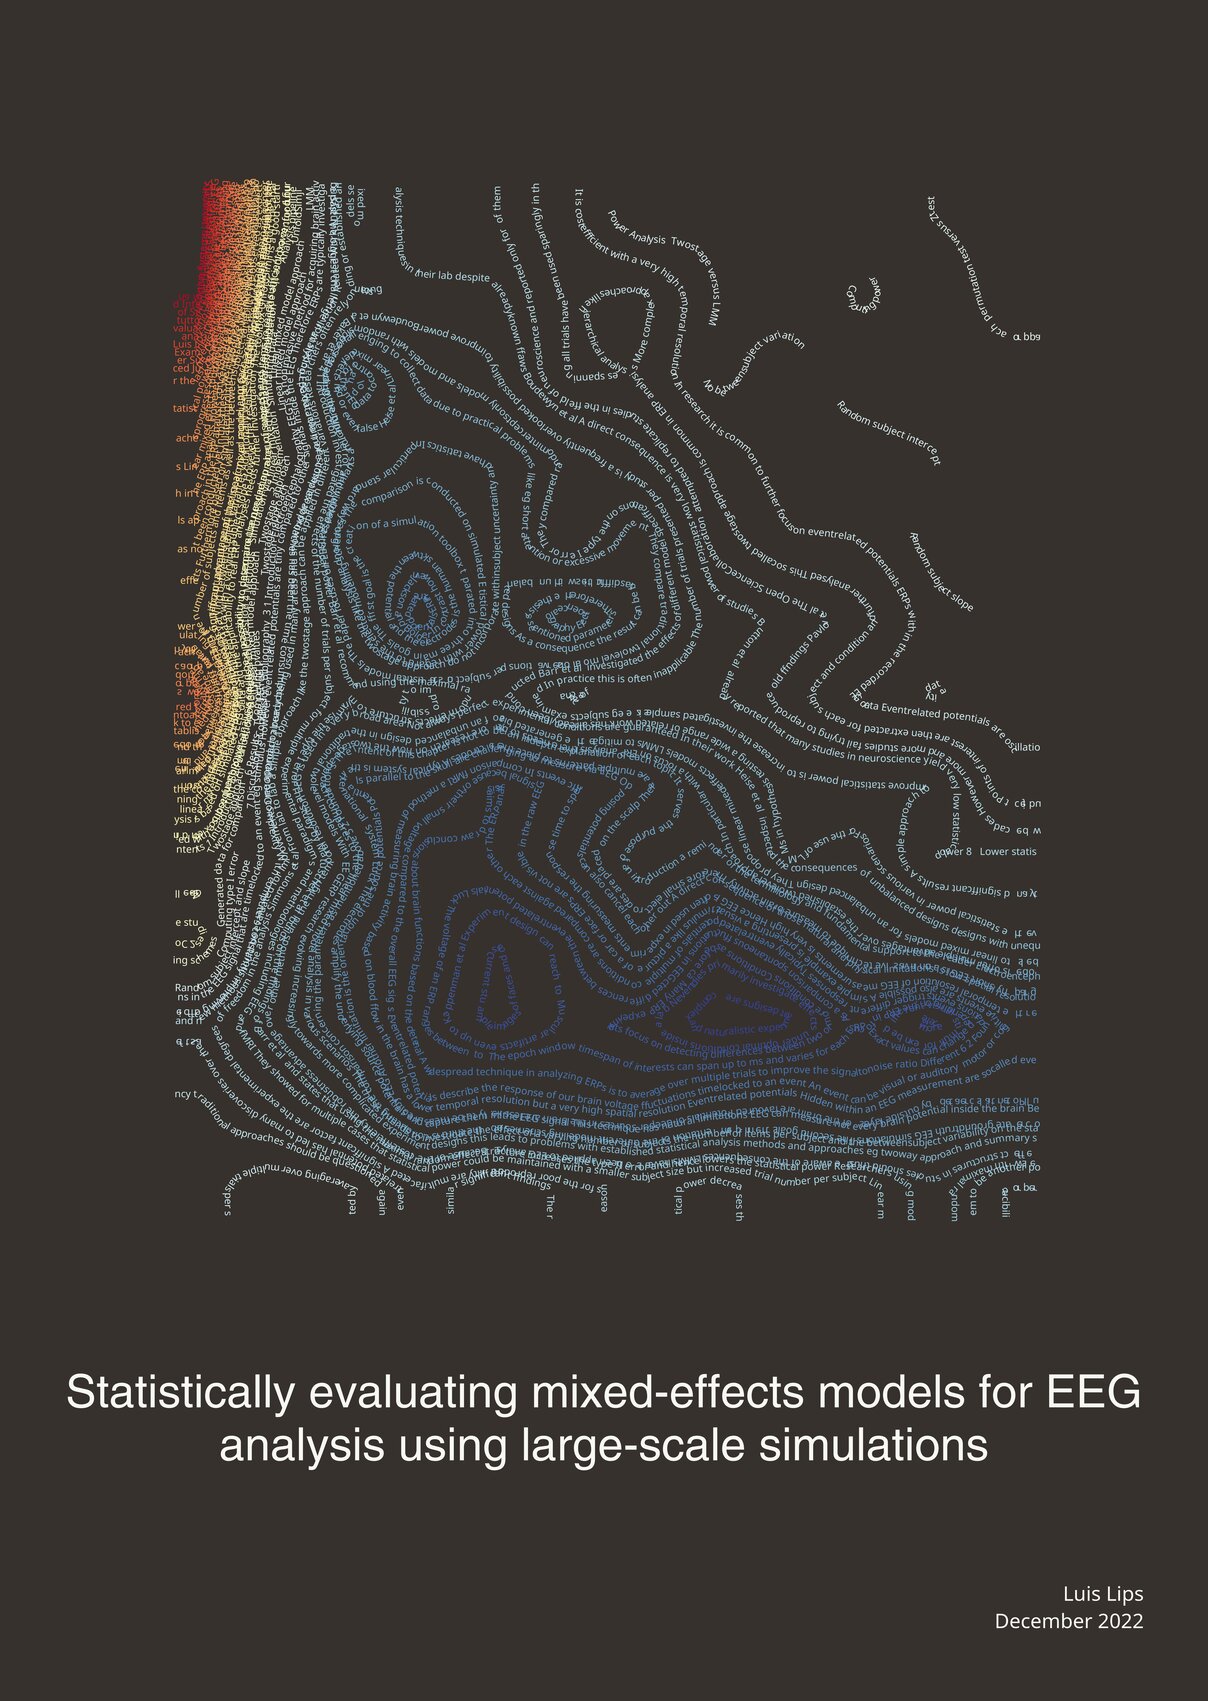
Luis Lips’ thesis evaluates two popular statistical approaches for analyzing EEG data. While the thesis art piece visualizes the quantitative difference between these methods through a heatmap-based graphic, a corollary was developing a brain activity simulation software package.
The Creation Process
Benedikt transformed the key empirical result from Luis’ thesis into a visually engaging graph. Extracting the contours of a heatmap required some creative hacking of the internals of Makie.jl, but the resulting image serves as a direct representation of the research’s quantitative findings.
Artistic Concept
The art piece shows statistical power differences between the two methods, spanning the space of recording more subjects or recording more trials within any each subject. The heatmap contours convey a visual narrative of how the two statistical approaches differ, creating a platform for exploring and discussing the nuances of EEG data analysis.
“The results figure from his thesis immediately stood out to me, and transforming it into a Thesis Art was a rewarding challenge.”
Benedikt Ehinger
Personal Reflection
This visualization highlights the intersection of science and design, turning complex data into an accessible graphic. “It brought the quantitative heart of Luis’ thesis to life in a visually compelling manner”, Benedikt says.
Luis recently started his PhD with Anil Seth in the UK, and the toolbox developed during his thesis has already been published — “an impressive milestone”, according to Benedikt.