P300 prediction errors in veridical and inferred information processing: an EEG study
for Maria Sokotushchenko
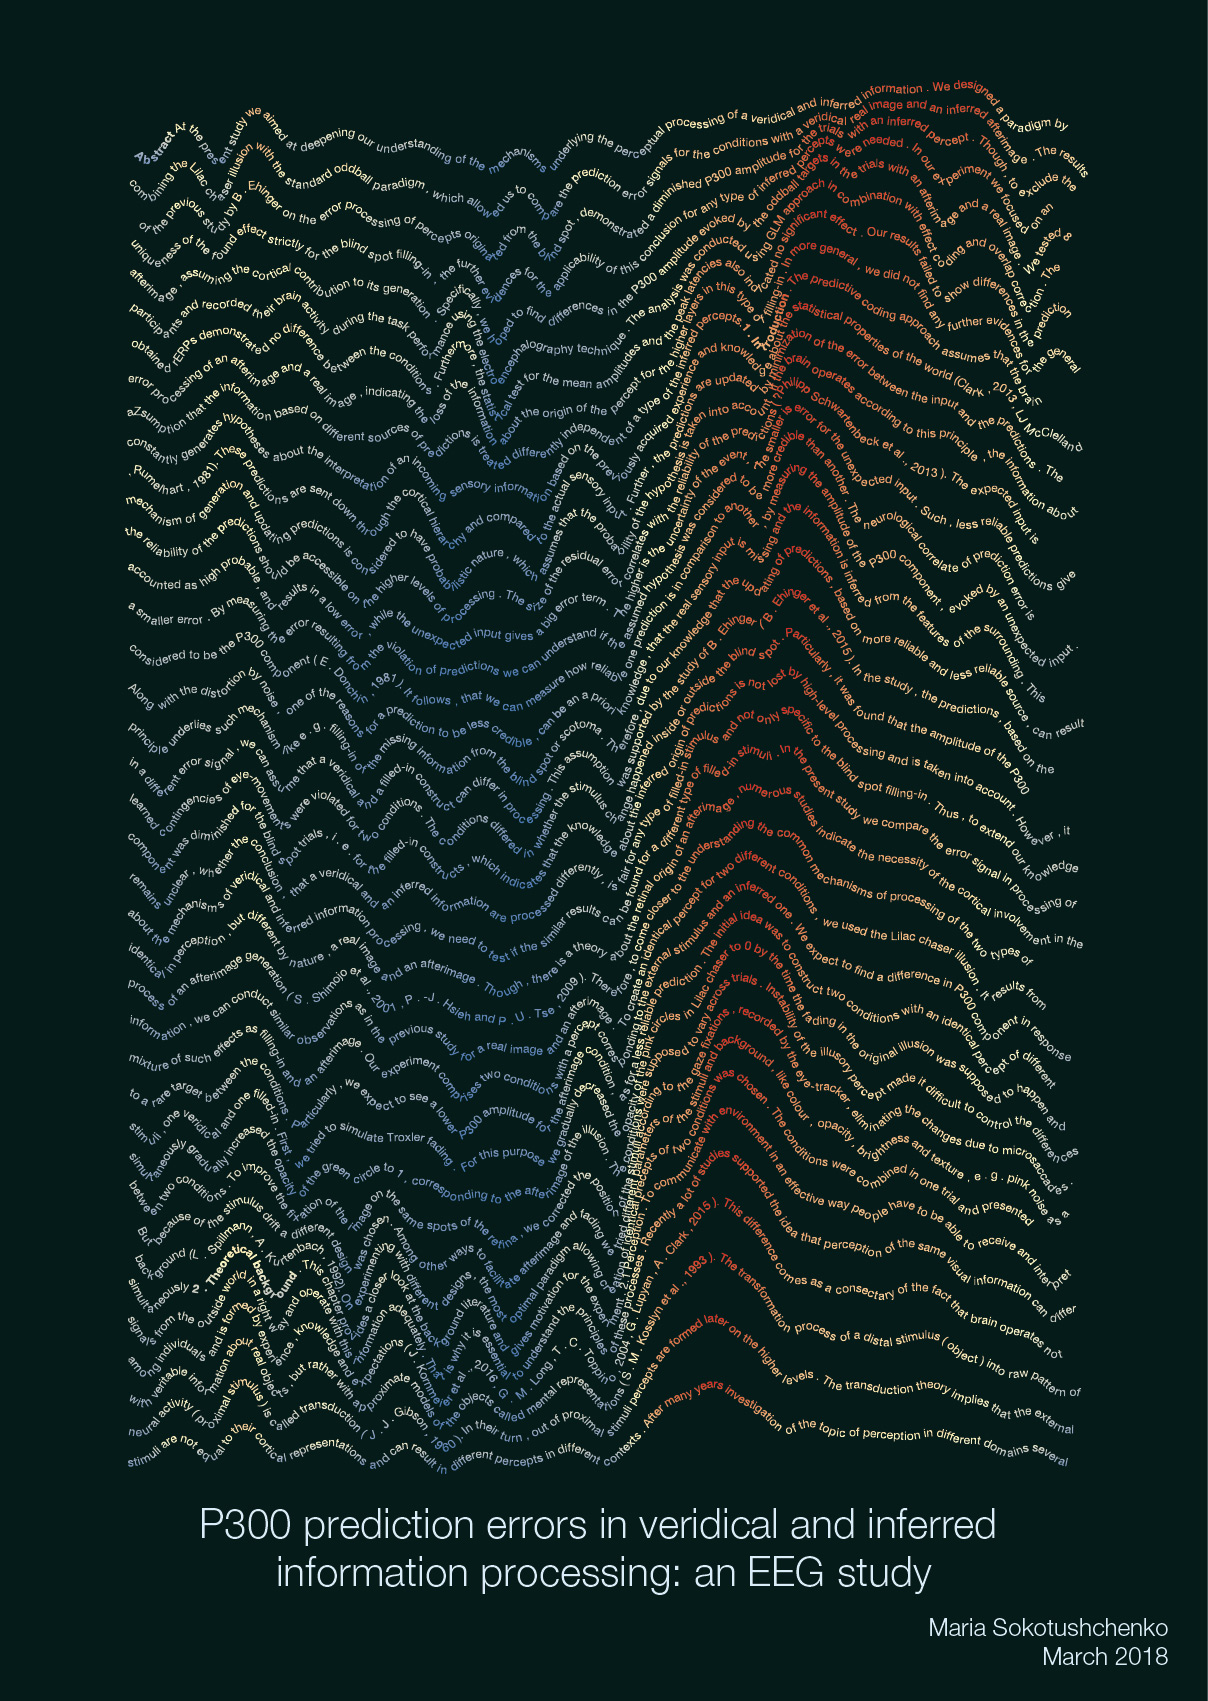
This work investigates whether the brain has access to whether a percept is veridical (real), or brain-generated (afterimage). Maria recorded prediction errors based on identical, but critically different percepts. The Thesis Art piece visualizes these brain responses (EEG/P300), highlighting a clear dependency of the surprise signal (red activity), on the peak latency of one participant (sorted along the vertical dimension).
The Creation Process
The plot was created in R, with a filter along the individual brain wave trials. Each individual line represents an EEG responses, the placement is sorted by their peak latency, focusing on the P300 component, which reflects a surprise or error in prediction. The color indicates the strength of the brain response at that moment. In many ways, the creation process mirrors what actual researchers would do with their EEG data.
Artistic Concept
The visual design of this piece reflects the EEG signal, which is commonly displayed similarly but without the color coding. The primary focus was on illustrating the surprise error (P300), and combining the data this way resulted in a visually engaging piece. This piece serves as a vericidal depiction of how our brain reacts to unexpected stimuli.
“Each trace in this plot isn’t a single trial — it’s the average of multiple repetitions, this highlights how individual and fleeting every single brain response is.”
Benedikt Ehinger
Personal Reflection
Benedikt shares: “The creating process was comparatively streamlined, but this plot belies the subtle complexities hidden within it.” While the study didn’t yield the expected conclusions, the artwork remains a reminder that sometimes even seemingly straightforward projects reveal unexpected depth.
This thesis art is the “first follower” in following Pinzuti’s approach of placing text on a trajectory. This technique would become a defining theme in later Thesis Art pieces, signaling a shift toward more dynamic, text-driven visualizations.