The Effects of Autocorrelation on Overlap Corrected rERPs
for Felix Schröder
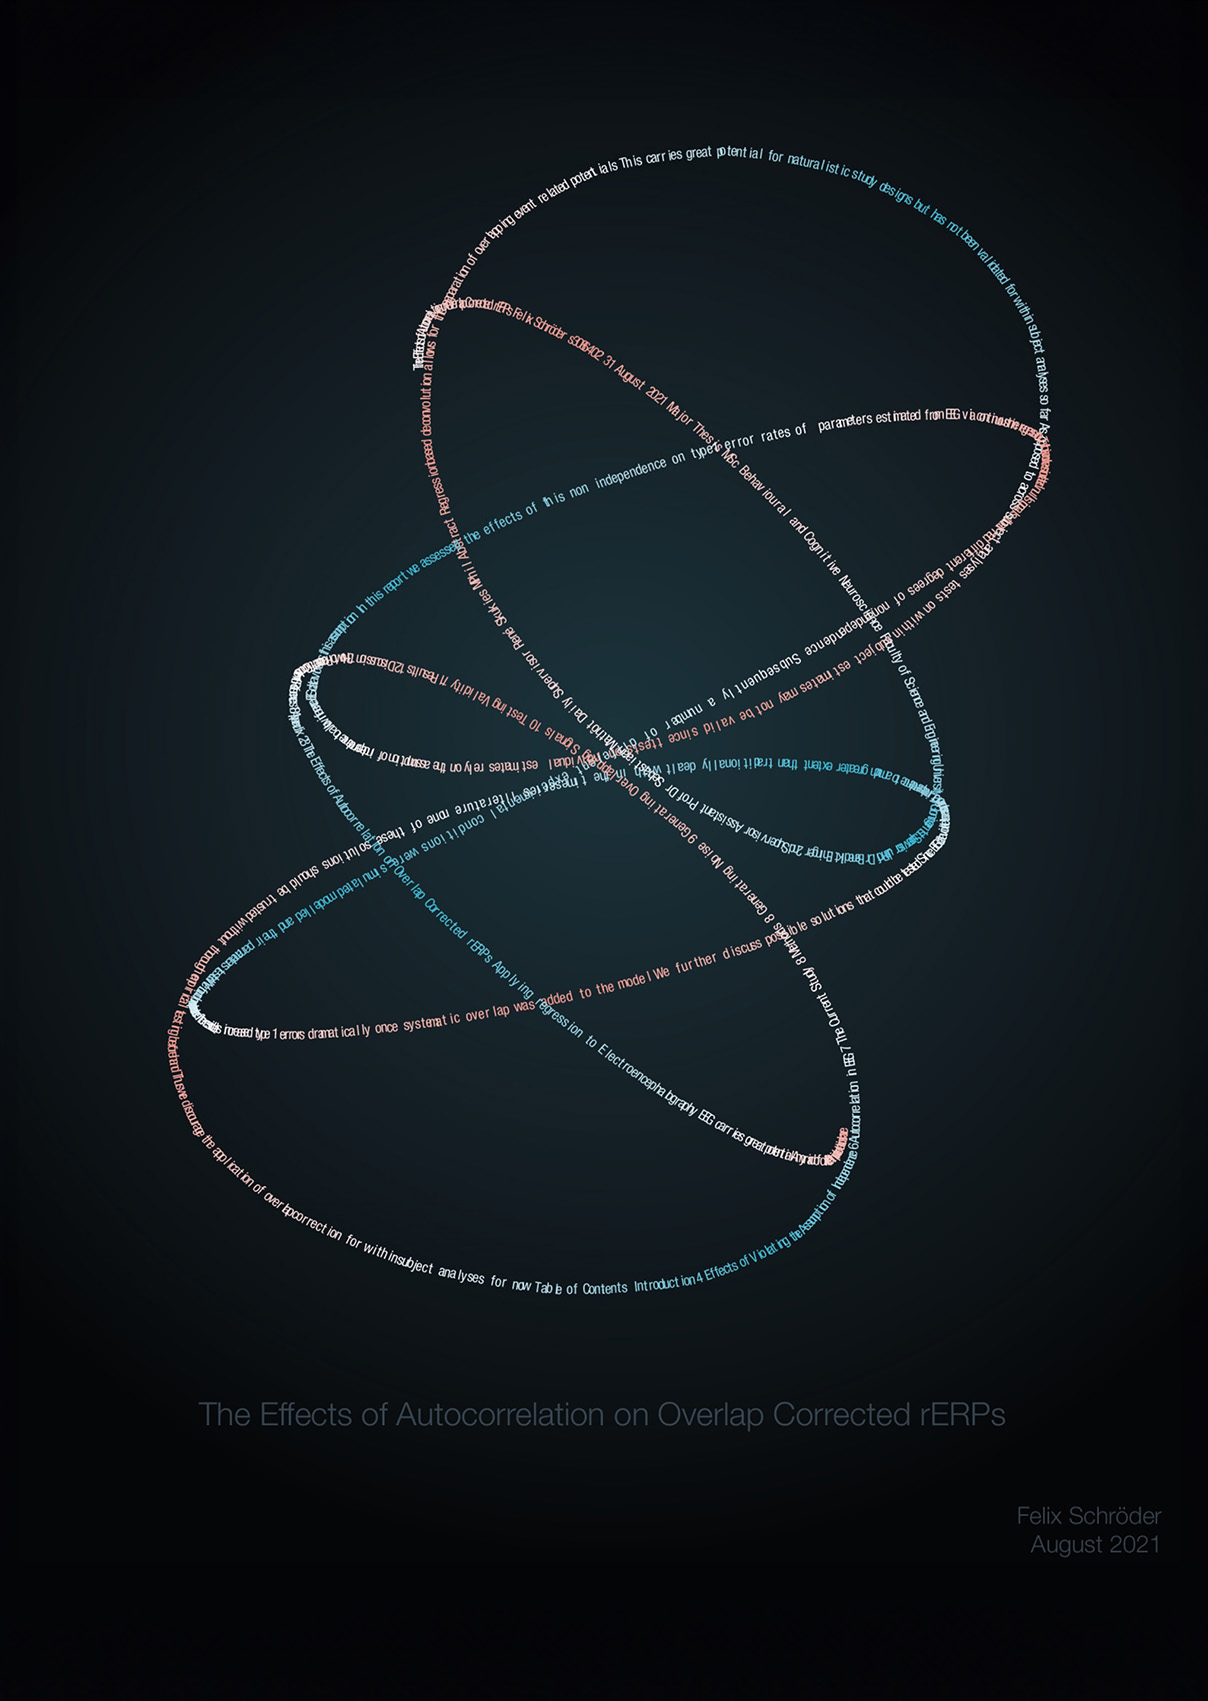
This thesis investigates the challenge of dealing with autocorrelation in brain activity: if signals at 103 ms and 104 ms are almost identical, how does this affect statistical analysis? The surprising result — it’s not as problematic as expected! The Thesis Art piece visualizes the time-embedding of the autocorrelation of an idealized signal at one time lag.
The Creation Process
This was the first Thesis Art piece where interactive sliders in Pluto.jl were used to fine-tune visualization parameters. Further, the first time Benedikt got support from René Skukies, a doctoral researcher in the same lab. The biggest technical challenge was text placement along plotted lines — without dedicated functions, coordinates had to be manually adjusted for even spacing. Some areas worked seamlessly, while others show unresolved problems with kerning.
Artistic Concept
Autocorrelation describes the correlation between lagged version of a time series. Typically, only a correlation coefficient for any each lag is of interest, but here we show the underlying “scatter”-plot of one such lag. The signal on the x-axis and a time-lagged version on the y-access. This replicates directly how an autocorrelation function is calculated. The structure also pays homage to the Möbius band sculptures of the artist P. Ariane Ehinger, reinforcing the theme of continuity and infinite patterns in brain activity.
“Felix took this work seriously — and so seriously, in fact, that he continued with a PhD in England! A perfect example of how research leads to more questions and deeper explorations.”
Benedikt Ehinger
Personal Reflection
Balancing the text alignment with the visualization proved tricky. “At that time, I hadn’t yet developed proper functions for text placement, so I had to get creative with subsampling the coordinates. It worked well in some areas, less so in others”, Benedikt notes.