A visual representation of intellectual pursuits

Category: Thesis Art

  • Haas’2021

    Haas’2021

    The benefits of de-convolution for processing complex EEG data

    for Jan Haas

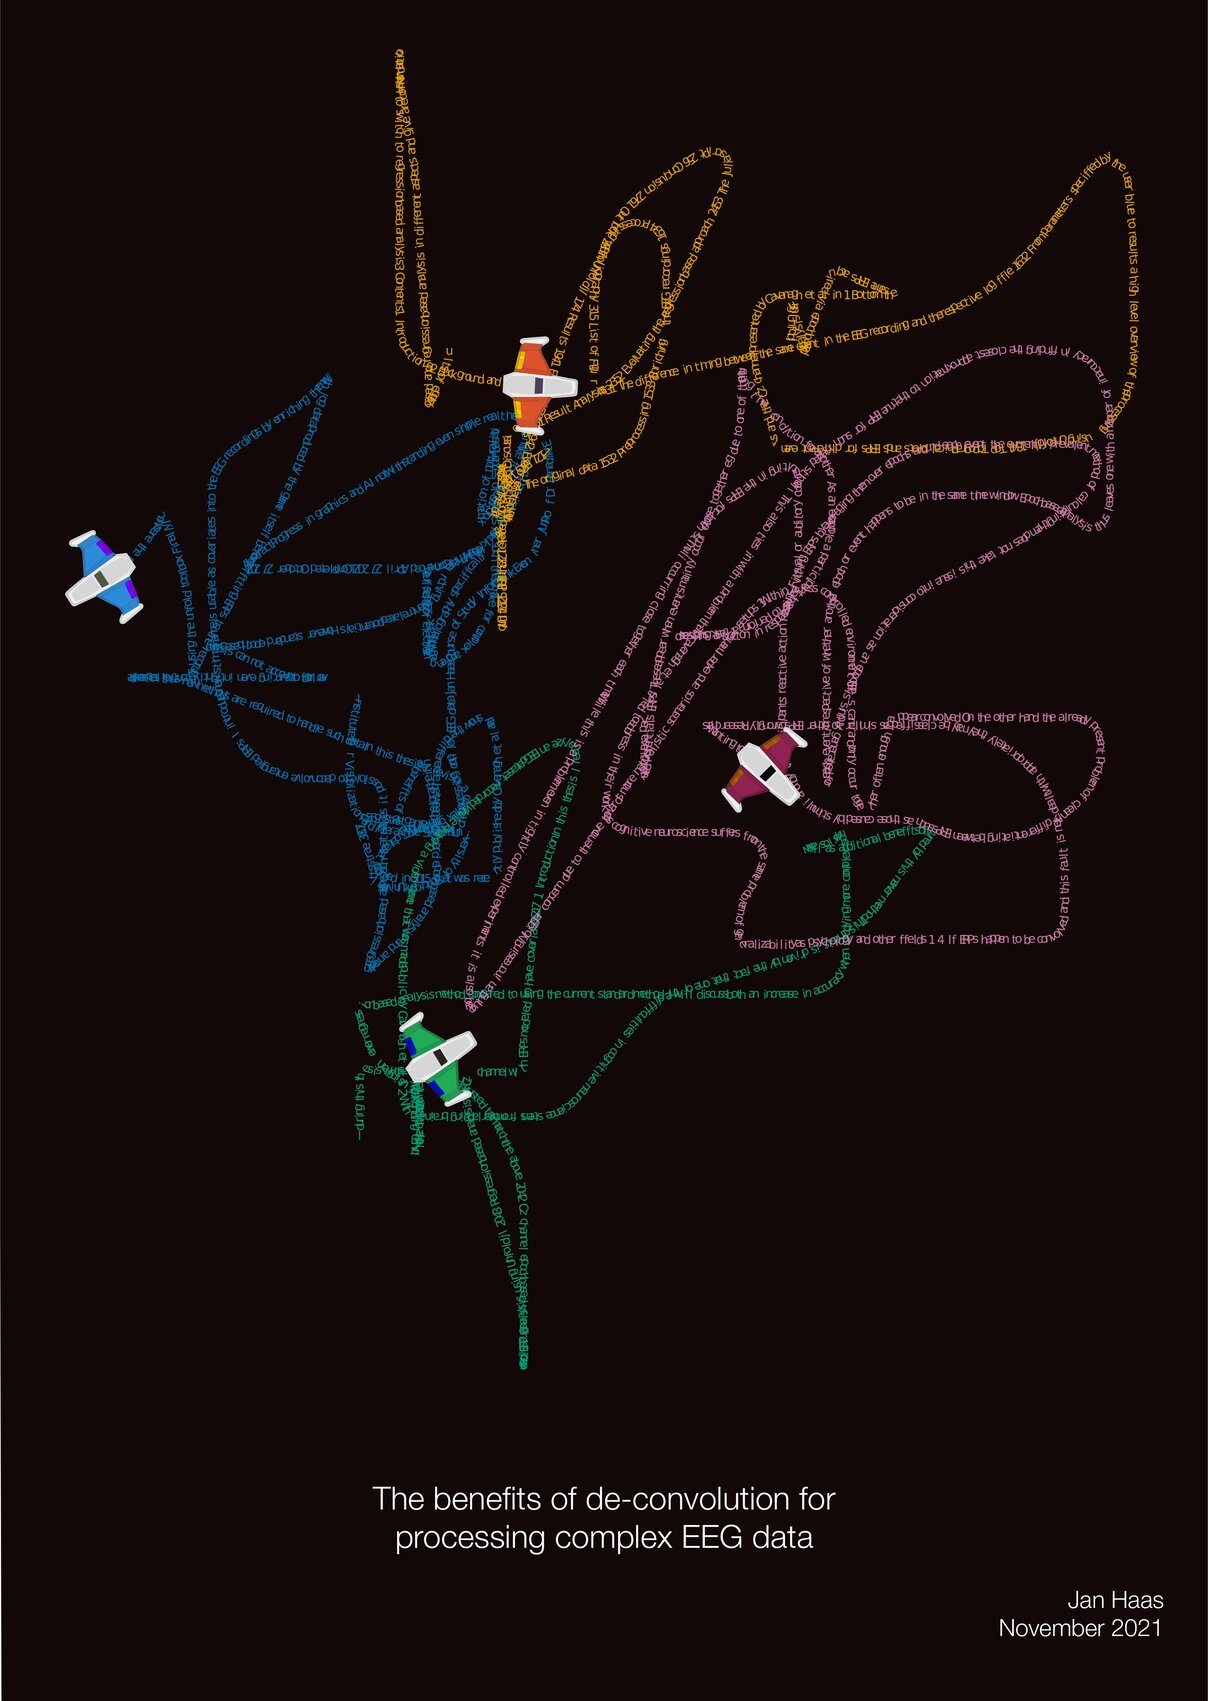
    Jan Haas’ thesis delves into the effects of computer gaming on the brain, using deconvolution techniques to better understand cognitive processes. The Thesis Art piece visualizes the in-game trajectories of players steering a spaceship, offering an innovative look at gameplay behavior.

    The Creation Process

    Benedikt visualized the key concept of gaming trajectories, representing the paths of human subjects as they dodged enemy spaceships. The simplicity of the task allowed for a smooth creation process, leading to a graphic that focuses on the novelty of gaming’s impact on brain activity.

    Artistic Concept

    The visual concept aims to represent the gameplay experience, a core element of Jan’s research. By showing the trajectories in a new way, the piece captures the essence of the experiment’s dynamics. The underlying game was a side-scroller space-ship shooter, thus the shown trajectories purposefully distort the actual underlying data.

    “This is my first piece where I’m depicting the experiment’s evolving process itself—rather than presenting the encompassing brain data. It’s a fun challenge to break away from conventional visualizations.”

    Benedikt Ehinger

    Personal Reflection

    Creating this piece was a more straightforward but “rewarding experience”. The colors, the trajectories and the space ship somehow fit together nicely, encompassing the underlying data of the 8-bit “Escape from asteroid axon” research game.
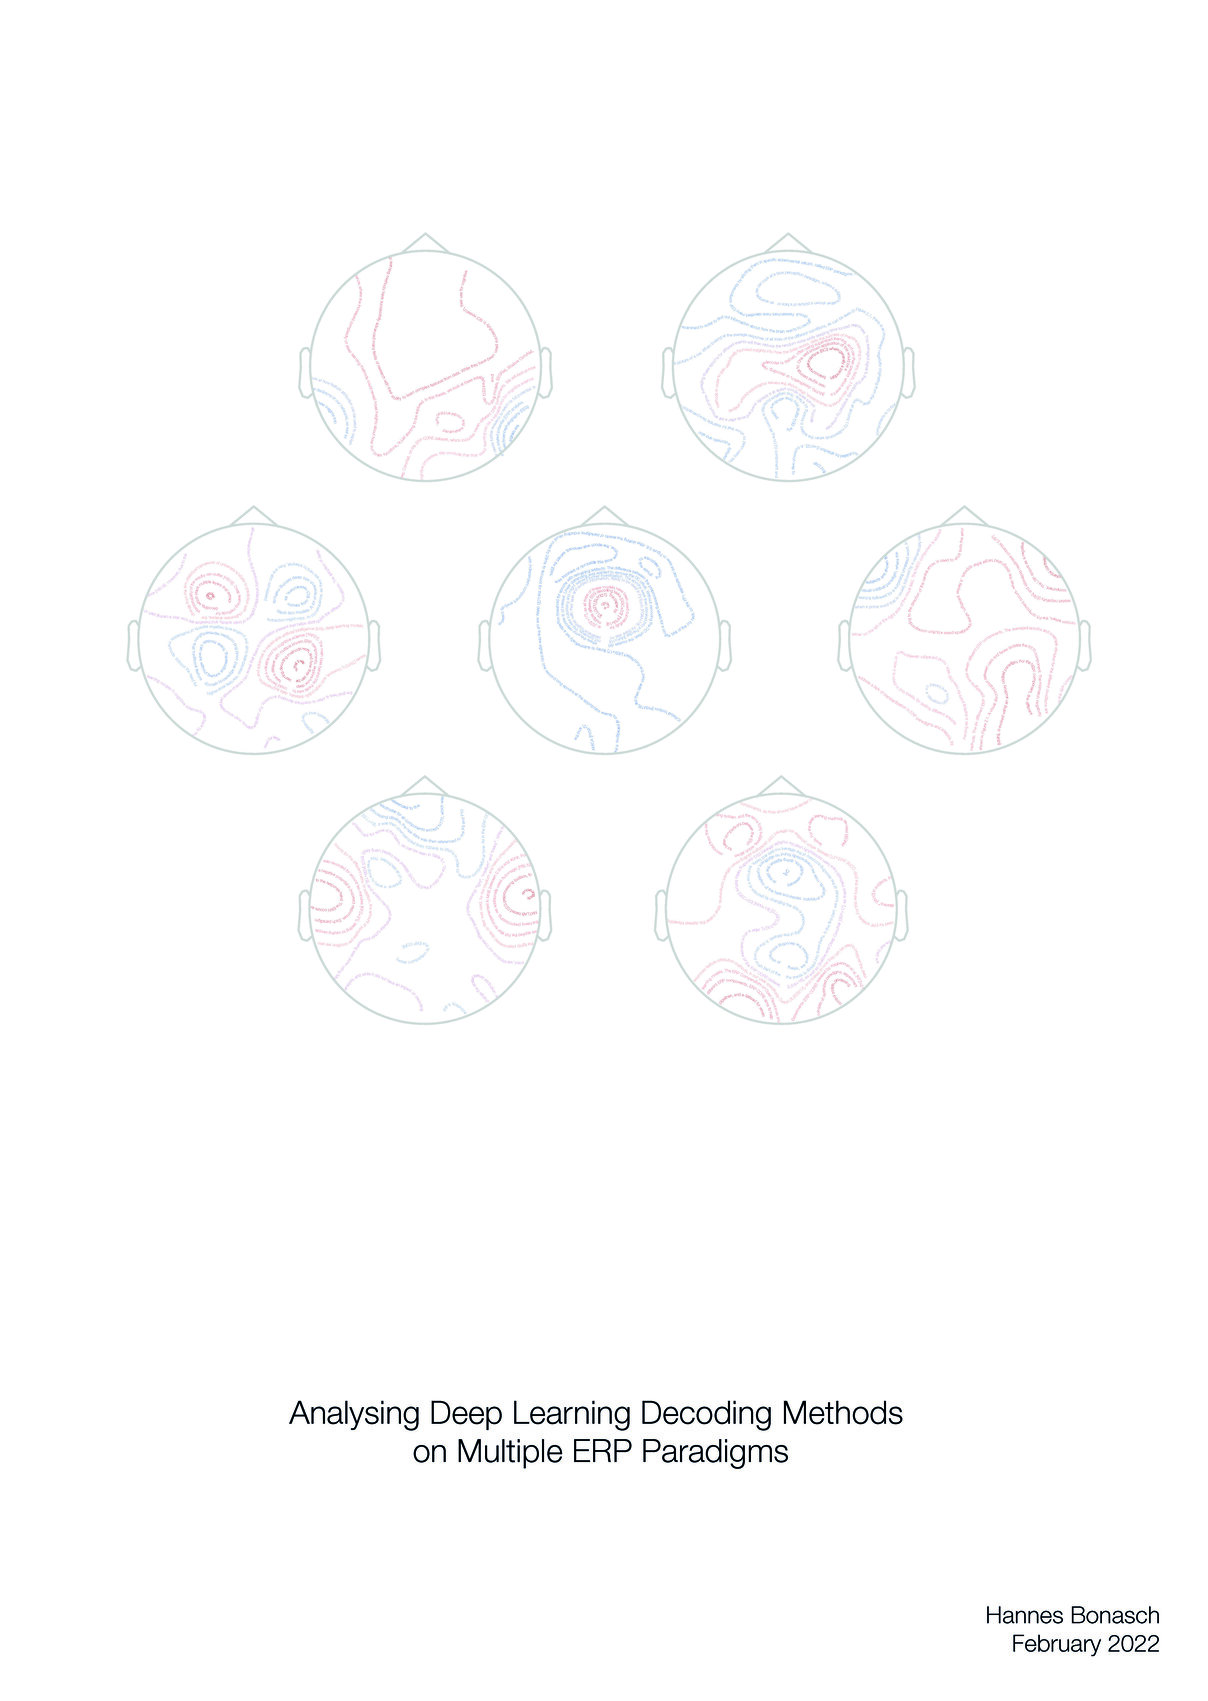
  • Bonasch’2022

    Bonasch’2022

    Analysing Deep Learning Decoding Methods on Multiple ERP Paradigm

    for Hannes Bonasch

    Hannes Bonasch explored how brain activity to different cognitive tasks relate to one another within the same brain. His surprising results show little to no correlation in brain activity across tasks. For the Thesis Art piece, Benedikt Ehinger visualized this by using topographical plots, creating a representation of the brain’s response to seven distinct tasks. This work lead to a publication on the very same topic.

    The Creation Process

    For this piece, Benedikt focused on representing the central brain activity patterns of all seven experimental tasks. He chose to use topographical plots, which are contour maps indicating areas of strong or weak brain activity. The different patterns also highlight the variety of brain activity that can be extracted from EEG data.

    Artistic Concept

    The visual concept needed to emphasize the diversity of tasks and their distinct brain activity locations. Seven tasks were chosen for their distinctiveness, and the number seven lent itself well to the design. The use of soft colors helps create a calm yet engaging image that contrasts the intensity of the brain activity it represents.

    “Topoplots are a tricky beast, I should know, I wrote the TopoPlots.jl visualization package.”

    Benedikt Ehinger

    Personal Reflection

    “The most challenging part of creating this piece was refining the text and layout in Adobe Illustrator. It took multiple iterations, but the printed version lacks the softness of the digital one! A part of this thesis was published, and it was great to see how our collaborative effort has already started making an impact in the field!”

  • Schröder’2021

    Schröder’2021

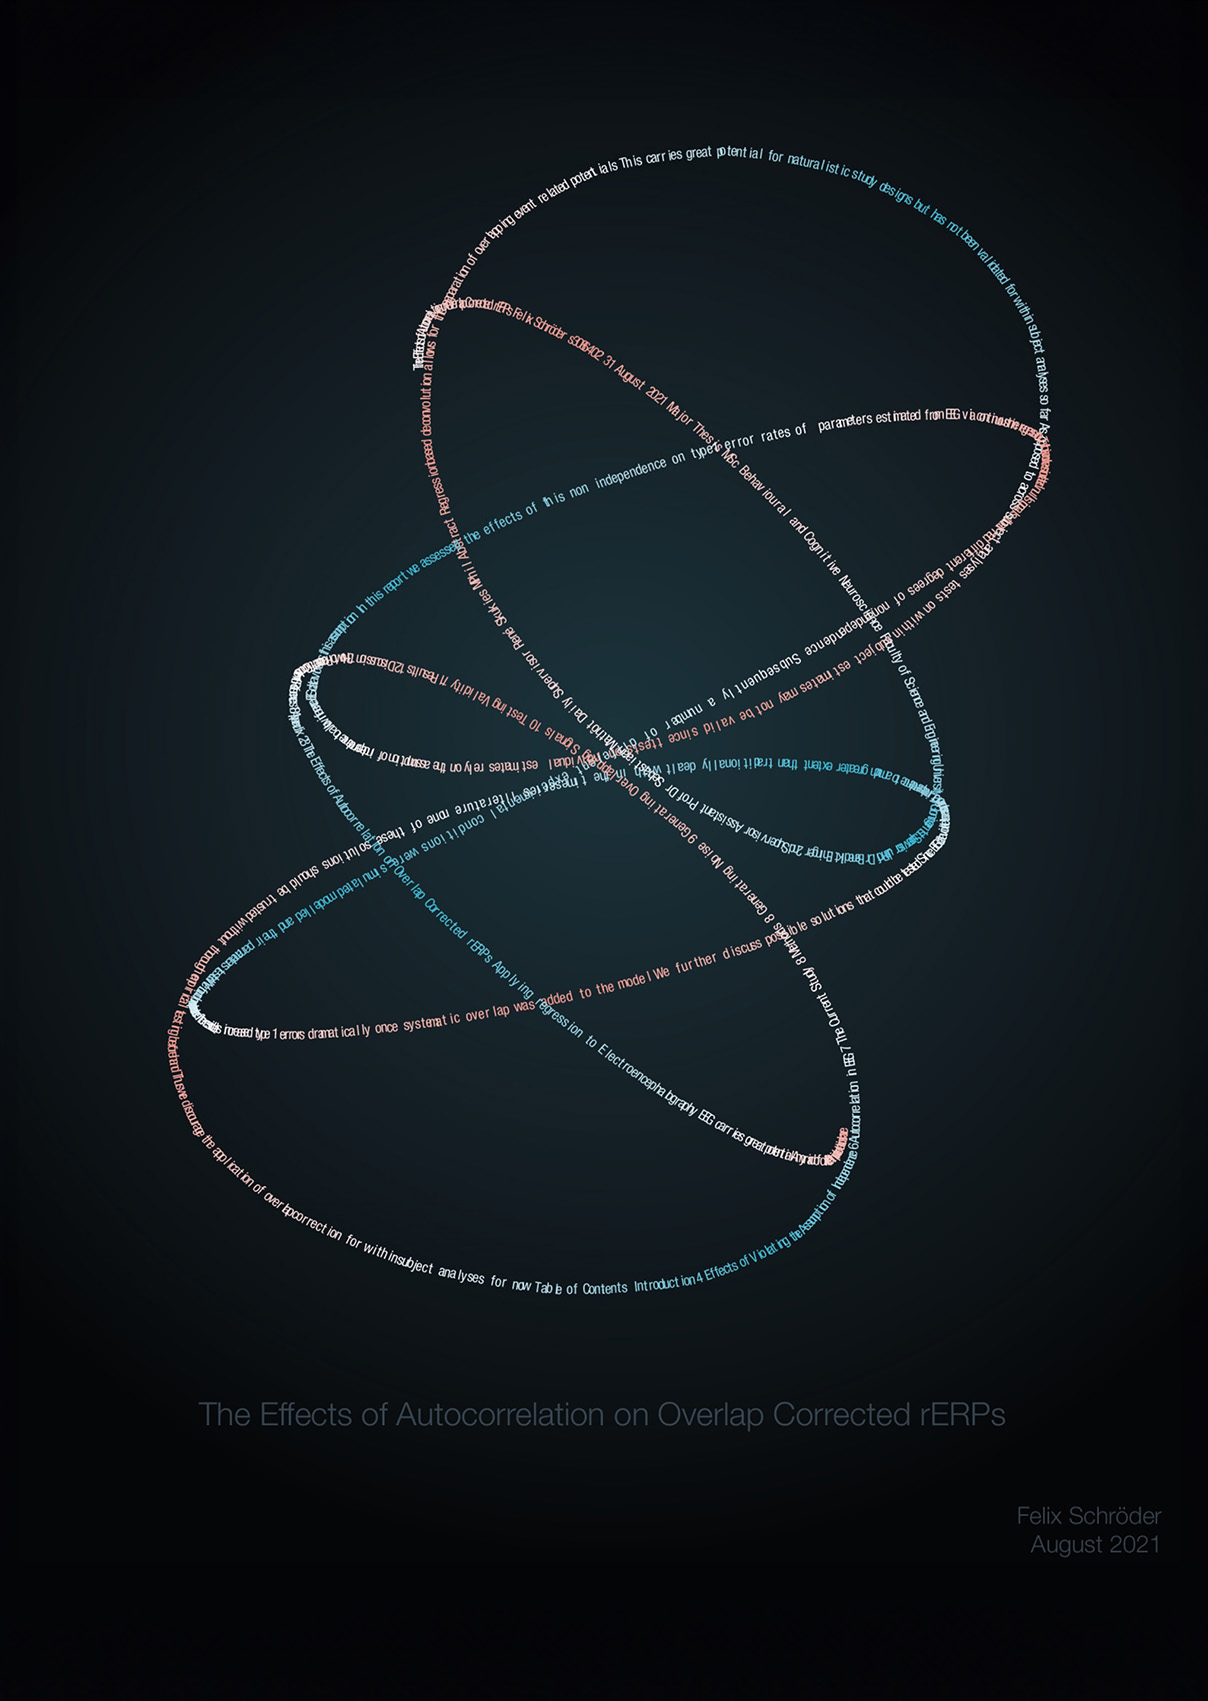
    The Effects of Autocorrelation on Overlap Corrected rERPs

    for Felix Schröder

    This thesis investigates the challenge of dealing with autocorrelation in brain activity: if signals at 103 ms and 104 ms are almost identical, how does this affect statistical analysis? The surprising result — it’s not as problematic as expected! The Thesis Art piece visualizes the time-embedding of the autocorrelation of an idealized signal at one time lag.

    The Creation Process

    This was the first Thesis Art piece where interactive sliders in Pluto.jl were used to fine-tune visualization parameters. Further, the first time Benedikt got support from René Skukies, a doctoral researcher in the same lab. The biggest technical challenge was text placement along plotted lines — without dedicated functions, coordinates had to be manually adjusted for even spacing. Some areas worked seamlessly, while others show unresolved problems with kerning.

    Artistic Concept

    Autocorrelation describes the correlation between lagged version of a time series. Typically, only a correlation coefficient for any each lag is of interest, but here we show the underlying “scatter”-plot of one such lag. The signal on the x-axis and a time-lagged version on the y-access. This replicates directly how an autocorrelation function is calculated. The structure also pays homage to the Möbius band sculptures of the artist P. Ariane Ehinger, reinforcing the theme of continuity and infinite patterns in brain activity.

    “Felix took this work seriously — and so seriously, in fact, that he continued with a PhD in England! A perfect example of how research leads to more questions and deeper explorations.”

    Benedikt Ehinger

    Personal Reflection

    Balancing the text alignment with the visualization proved tricky. “At that time, I hadn’t yet developed proper functions for text placement, so I had to get creative with subsampling the coordinates. It worked well in some areas, less so in others”, Benedikt notes.

  • Degutis’2020

    Degutis’2020

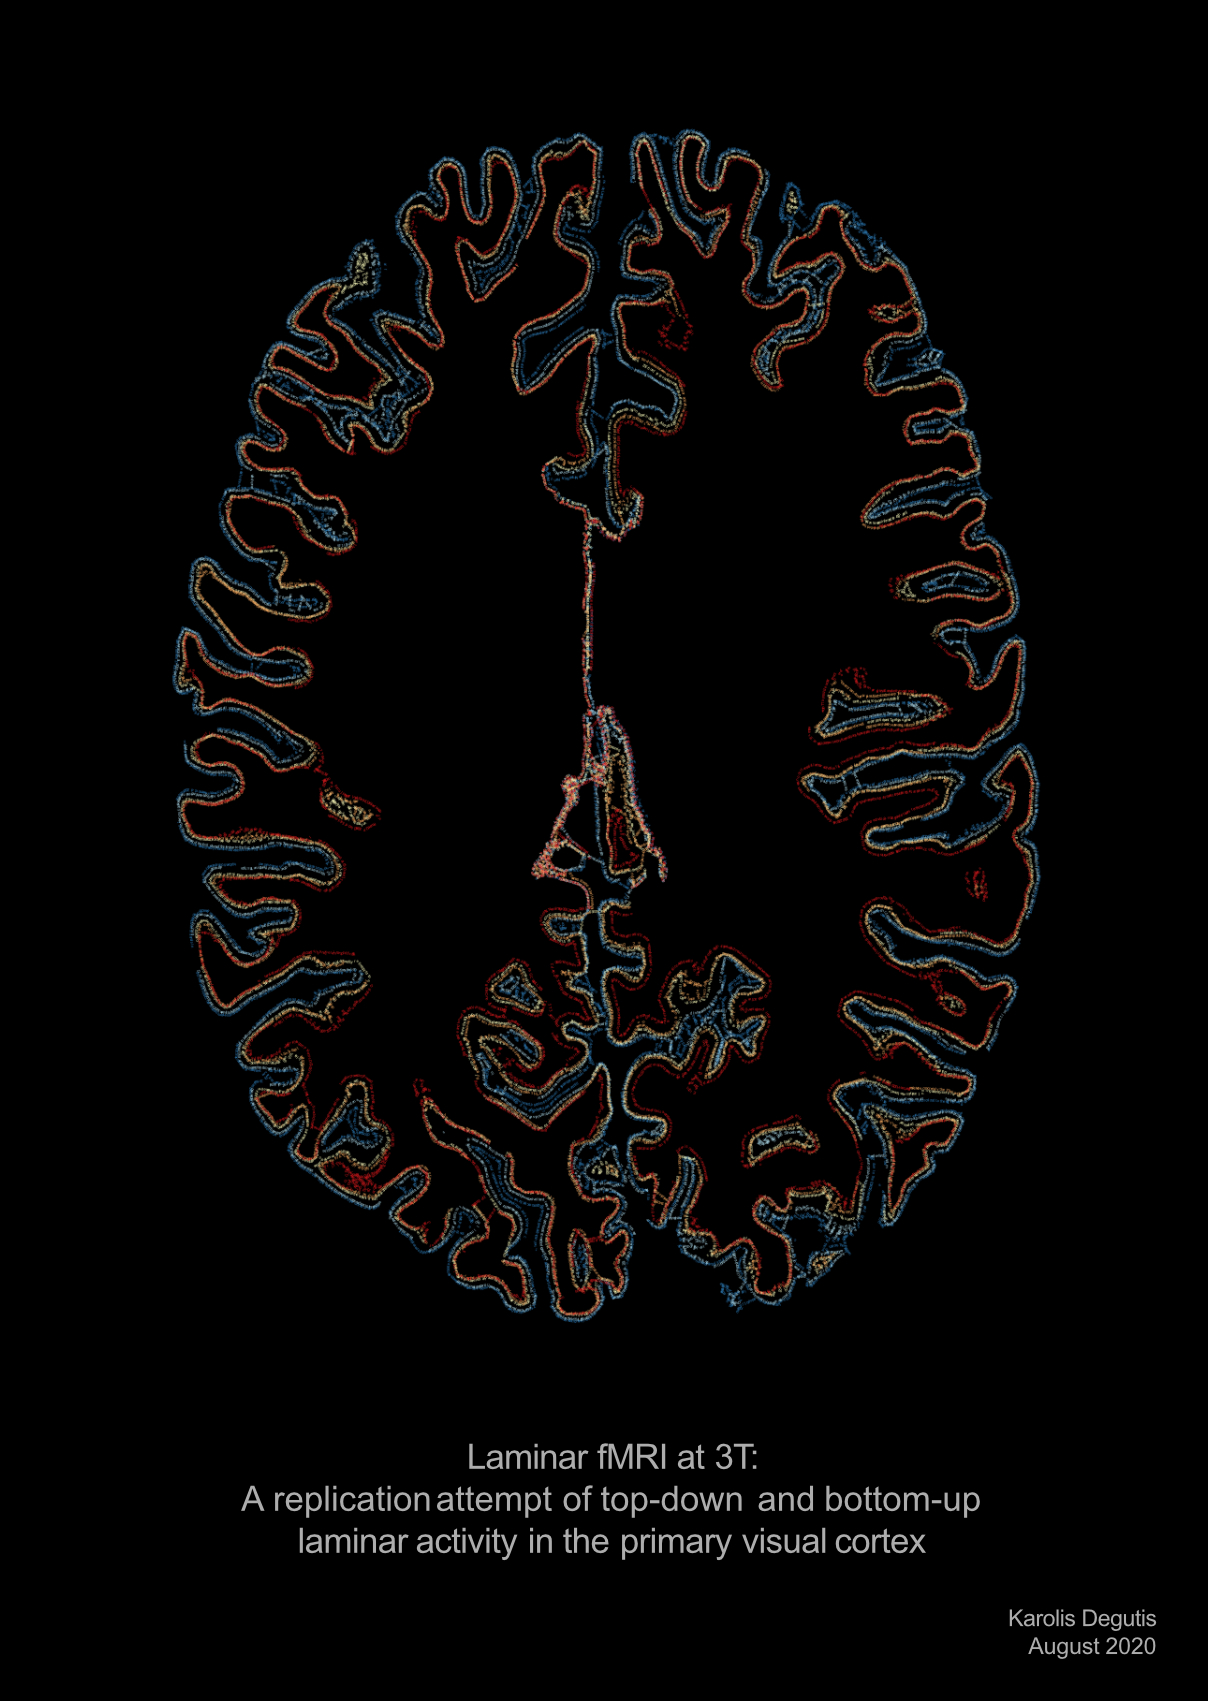
    Laminar fMRI at 3T: A replication attempt of top-down and bottom-up laminar activity in the primary visual cortex

    for Karolis Degutis

    This thesis explored whether laminar fMRI at 3T could replicate findings from higher-field 7T fMRI experiments. While the attempt ultimately failed, it led to a beautiful visualization of the brain’s layered gray matter.

    The Creation Process

    This was the first Thesis Art piece created using Makie.jl in the JuliaLang programming language. A key challenge was creating paths along the cortex, a challenge for visualization but also a challenge for laminar data-analysis itself — since only discrete points were available, Benedikt employed algorithms to solve the Traveling Salesman Problem to determine the shortest path linking them.

    Artistic Concept

    Since this project involved MRI data, the choice of a brain underlying the final visualization seemed natural. The art piece highlights the cortex’s layered structure while integrating nearly the entire thesis as embedded text within the brain’s folds.

    “This is Karolis’ actual brain! He later pursued a PhD on a related topic, and we remain forever connected — both through neuroscience and our mutual love for DakhaBrakha.”

    Benedikt Ehinger

    Personal Reflection

    “I love these kinds of images because they reveal the uniqueness, beauty, and fractal nature of the human brain”, Benedikt reflects on the piece’s impact.

  • Groß’2018

    Groß’2018

    A new eye tracking test battery: Evaluation of Pupil Labs glasses against EyeLink 1000

    for Katharina Groß

    This thesis developed a benchmark test to evaluate the strengths and weaknesses of two popular eye-trackers. The Thesis Art piece visualizes six key tasks from the benchmark, highlighting the complexity and intrincancies of eye movements.

    The Creation Process

    The test benchmark included 10 distinct eye-tracking tasks, of which six were visualized here. These tasks ranged from blinks and smooth pursuit to accuracie measurements, miniature eye movements, and also unrestricted viewing. The data processing and visualizations were created using R, which proved challenging due to slow rendering times and many glyphs. Post-processing in Adobe Illustrator added further complexity, with frequent crashes testing the limits of patience and perseverance.

    Artistic Concept

    The visualization highlights the comparison between two eye-trackers, represented by distinct green and orange colored glyphs. Each task can be recognized by the underlying eye-movement time series data.

    “I think the final piece really captures the core of the research. It’s a blend of complex science and creative representation.”

    Benedikt Ehinger

    Personal Reflection

    “Working with R for this project was a steep learning curve, especially with the rendering issues. Illustrator didn’t make it any easier, with constant crashes slowing down progress.It was frustrating at times, but ultimately very rewarding”, he says.

    This thesis led to a widely recognized publication, and the benchmark test is now used in multiple other studies, underscoring its lasting impact.

  • Vortmann’2018

    Vortmann’2018

    Unsupervised Decoding of Visuospatial Attention Performance in a Multiple Object Tracking Task using EEG Steady-State Analysis

    for Lisa-Marie Vortmann

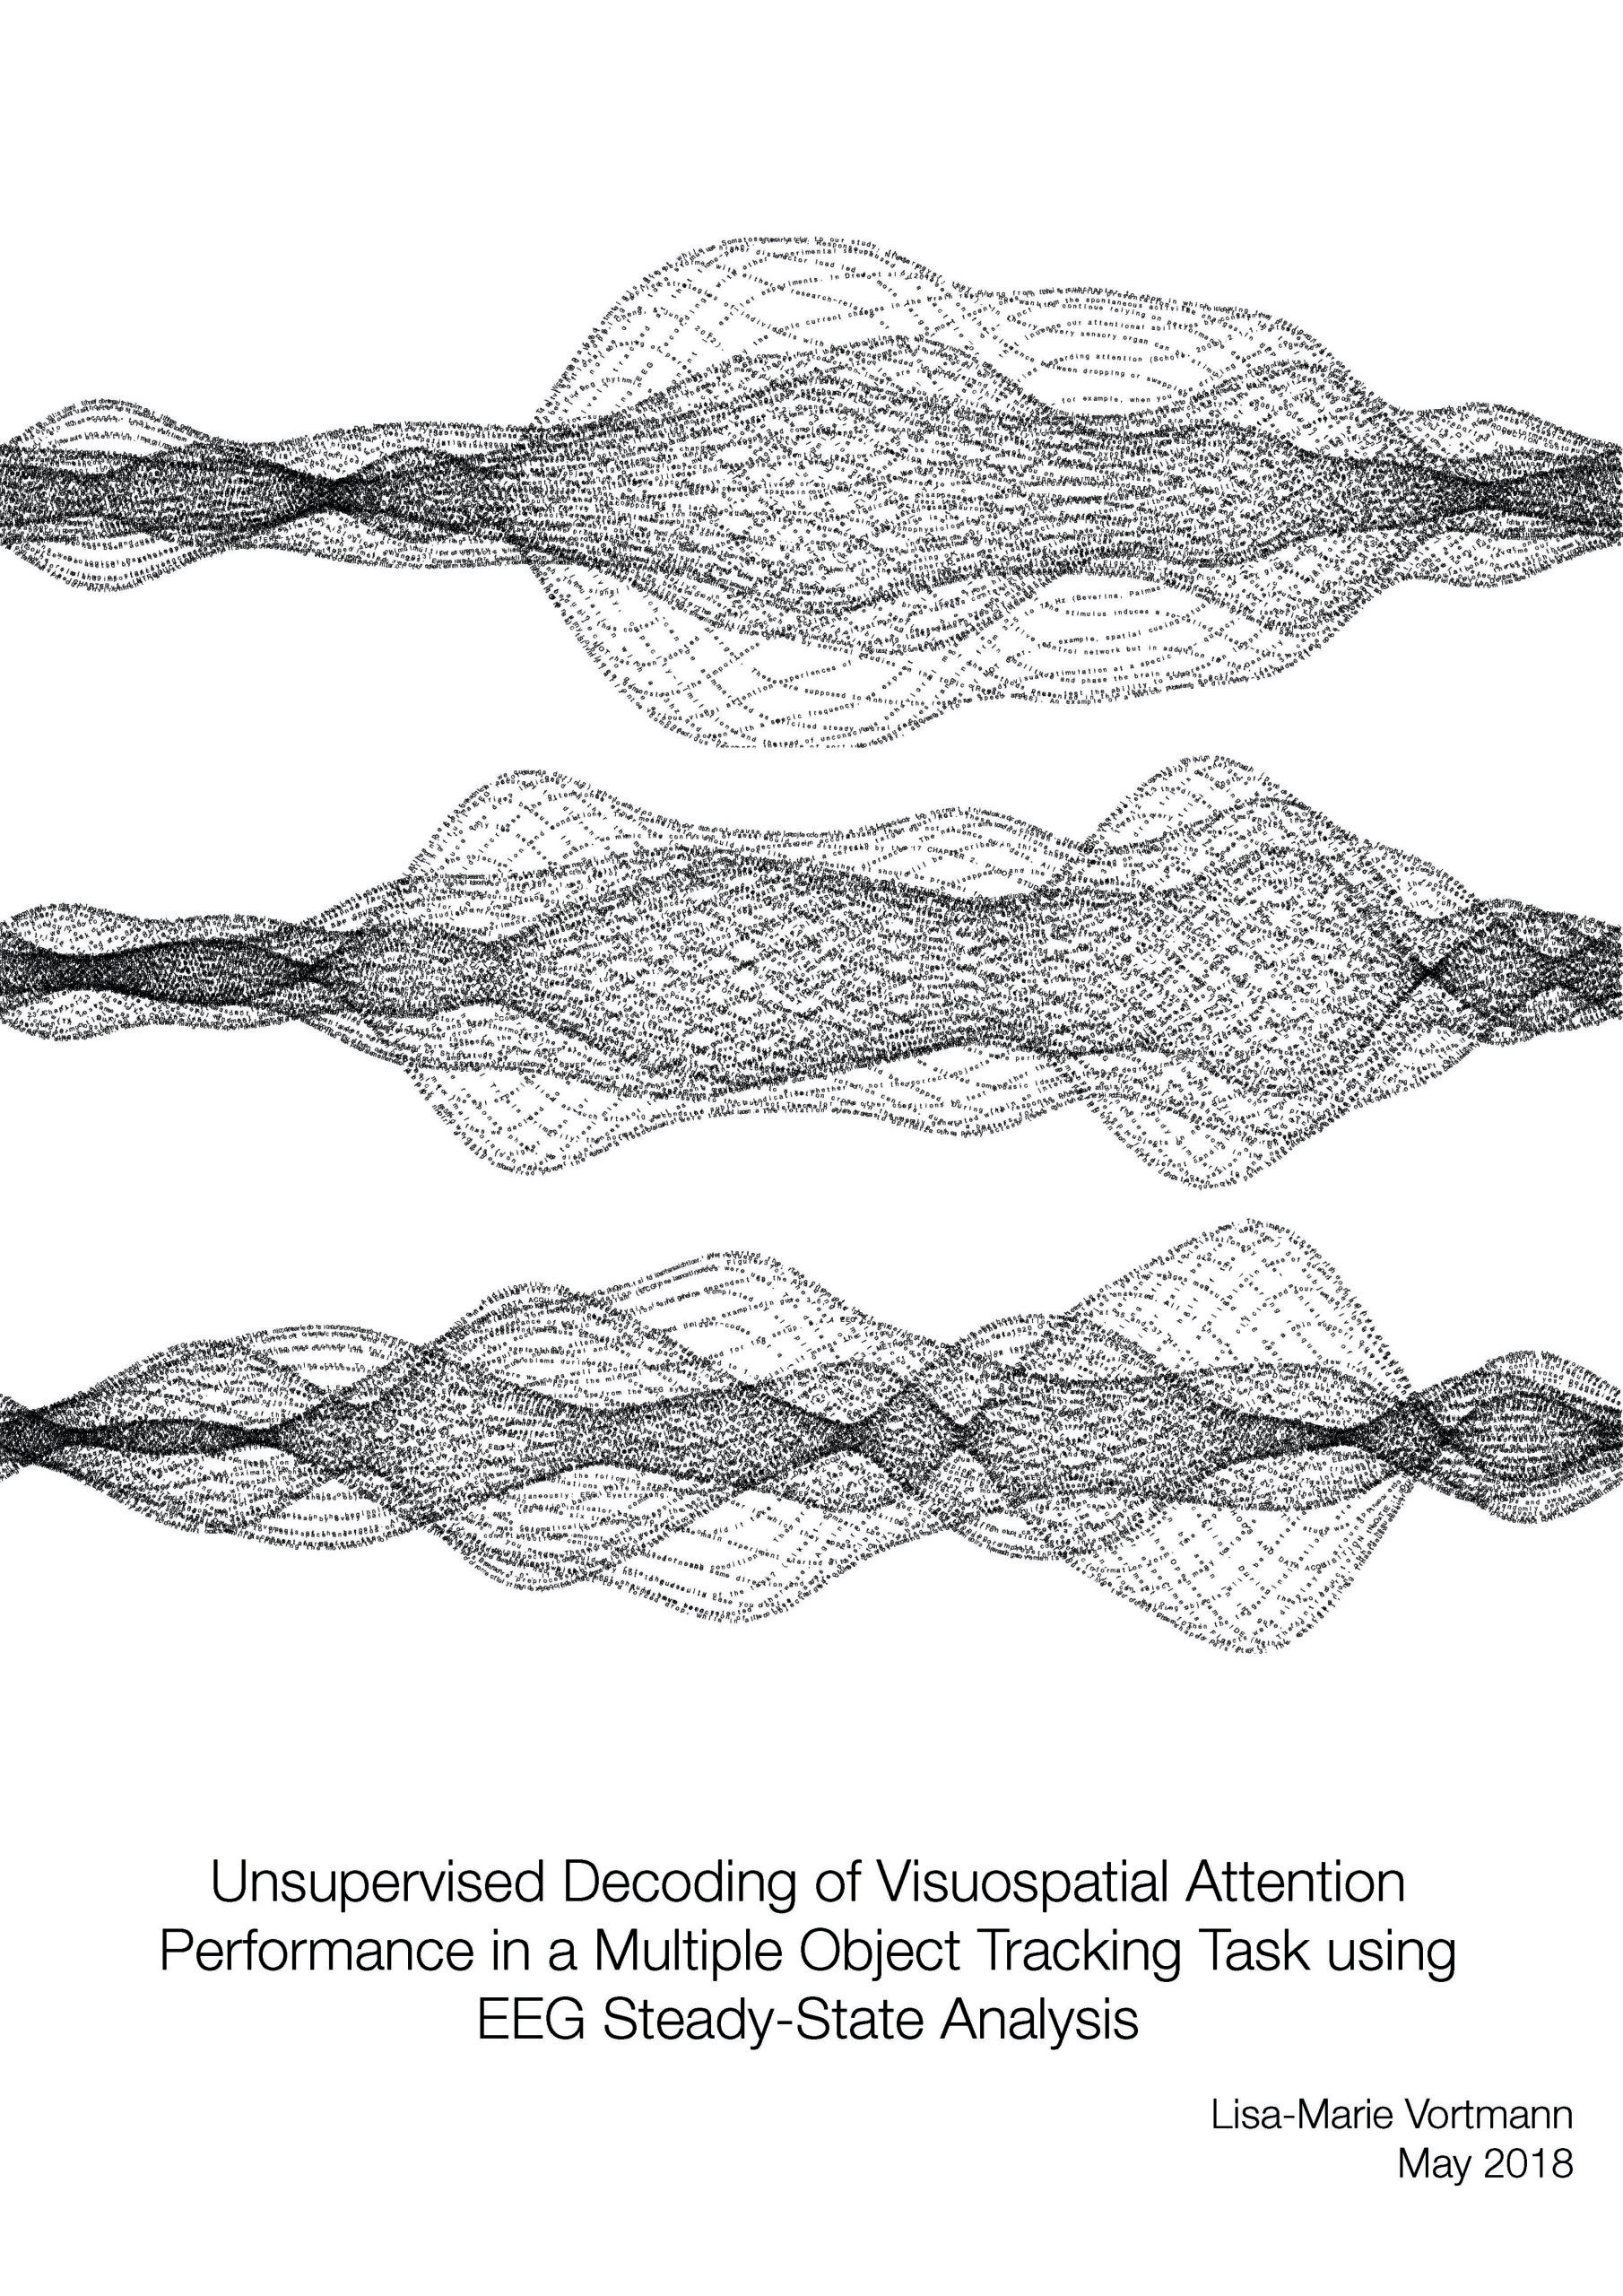
    This research explores how the brain sometimes tracks multiple objects (e.g. a flight controller) and how brain activity can be used to find out when tracking any such object fails. The Thesis Art piece visualizes EEG data over time, depicting tracking errors and the challenge of decoding brain signals.

    The Creation Process

    The visualization was created using R and ggplot, with an emphasis on bandpass filtering to capture the underlying brain activity. A trick was used: Flickering the objects (like a stroboscope) at different frequencies allows tracing the processing of each object throughout the brain. With some advanced signal processing techniques, one can then recover the traces.

    Artistic Concept

    The visual concept reflects how brain activity marks stimuli and shows how these marks can be detected by an external observer. Because the bandpass restricts the signal to near-singular sinoidal band, we can make use of an aliasing effects to let a new second-order dynamics emerge. This closely corresponds to the hidden dynamics of brain activity. The triptych format was chosen to highlight the different phases of tracking and loss in the experiment.

    “EEG data has the potential to reveal more than just brain signals — it can show how attention works, but this study is also a reminder that results are not always universal.”

    Benedikt Ehinger

    Personal Reflection

    Reflecting on the process, Benedikt notes: “While the experiment succeeded perfectly when recording Lisa’s own brain activity, it didn’t work with 90% of other participants, leaving us puzzled.” Benedikt later followed up on this puzzle, but more work needs to be done. Despite these challenges, creating the artwork that visually represents brain activity felt rewarding to Benedikt. “It pushed the boundaries of signal processing and offered a literal depiction of how brain signals can be interpreted by others,” he notes.

    Lisa-Marie is now a professor at the University of Groningen.