Analysing Deep Learning Decoding Methods on Multiple ERP Paradigm
for Hannes Bonasch
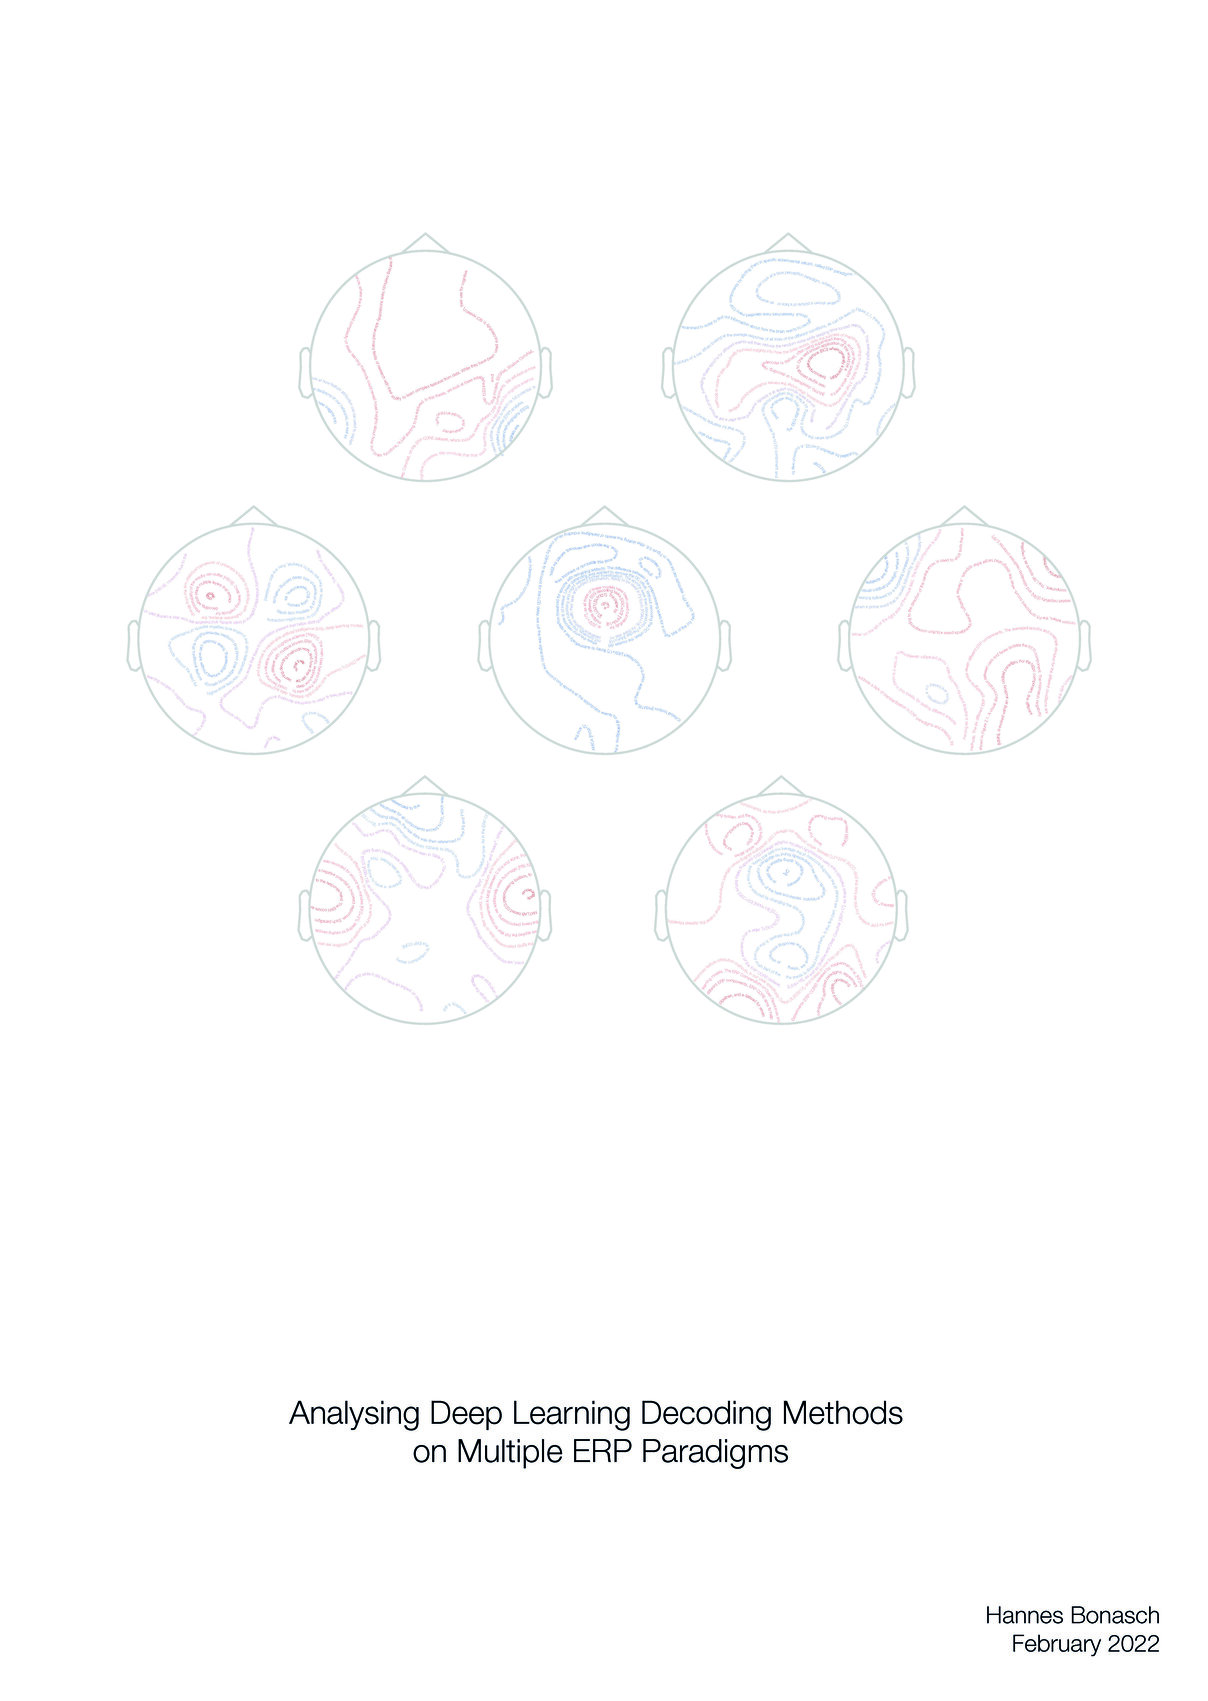
Hannes Bonasch explored how brain activity to different cognitive tasks relate to one another within the same brain. His surprising results show little to no correlation in brain activity across tasks. For the Thesis Art piece, Benedikt Ehinger visualized this by using topographical plots, creating a representation of the brain’s response to seven distinct tasks. This work lead to a publication on the very same topic.
The Creation Process
For this piece, Benedikt focused on representing the central brain activity patterns of all seven experimental tasks. He chose to use topographical plots, which are contour maps indicating areas of strong or weak brain activity. The different patterns also highlight the variety of brain activity that can be extracted from EEG data.
Artistic Concept
The visual concept needed to emphasize the diversity of tasks and their distinct brain activity locations. Seven tasks were chosen for their distinctiveness, and the number seven lent itself well to the design. The use of soft colors helps create a calm yet engaging image that contrasts the intensity of the brain activity it represents.
“Topoplots are a tricky beast, I should know, I wrote the TopoPlots.jl visualization package.”
Benedikt Ehinger
Personal Reflection
“The most challenging part of creating this piece was refining the text and layout in Adobe Illustrator. It took multiple iterations, but the printed version lacks the softness of the digital one! A part of this thesis was published, and it was great to see how our collaborative effort has already started making an impact in the field!”